Ward Clustering
Ward Clustering
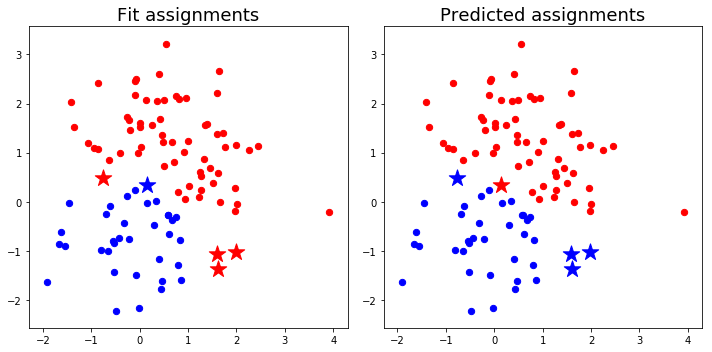
We fit some random points to 2 clusters using the Ward metric and then predict their cluster assignments using the new prediction function. Due to the cardinality dependence of the Ward objective function, data points at the edges of clusters may be assigned to different clusters than the ones to which they were fit.
Generate some random data
In [1]:
%matplotlib inline
from matplotlib import pyplot as plt
import numpy as np
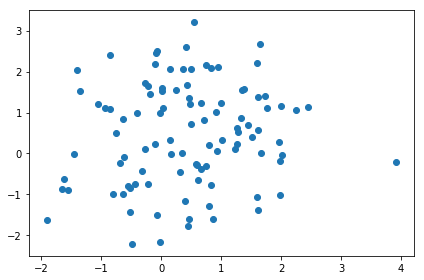
xy1 = np.random.randn(50,2)
xy2 = np.random.randn(50,2)+1
xy = np.concatenate([xy1,xy2])
plt.scatter(xy[:,0], xy[:,1])
plt.tight_layout()
Cluster with Ward clustering
In [2]:
from msmbuilder.cluster import LandmarkAgglomerative
clusterer = LandmarkAgglomerative(
    n_clusters=2, n_landmarks=None,
    linkage='ward', metric='euclidean')
clusterer.fit([xy])
fit_assignments = clusterer.landmark_labels_
predict_assignments = clusterer.predict([xy])[0]
Investigate fit/predict fidelity
In [3]:
count = np.sum(fit_assignments == predict_assignments)
print("Prediction maintains {}% fidelity to fit assignments."
      .format(100*count/(xy.shape[0])))
In [4]:
discrep_list = np.where(fit_assignments != predict_assignments)[0]
discrep_list
Out[4]:
Group fit and predict points by cluster assignments
In [5]:
fit_0 = xy[fit_assignments == 0]
fit_1 = xy[fit_assignments == 1]

pred_0 = xy[predict_assignments == 0]
pred_1 = xy[predict_assignments == 1]

c_fit_list = fit_assignments[discrep_list]
c_pred_list = predict_assignments[discrep_list]
Visualize clustering results
Highlight discrepancies between fit and predict
In [6]:
fig = plt.figure(figsize=(10,5))

ax1 = plt.subplot(1,2,1)
plt.title('Fit assignments',fontsize=18)
plt.scatter(fit_0[:,0],fit_0[:,1],c='b',s=40)
plt.scatter(fit_1[:,0],fit_1[:,1],c='r',s=40)

xy_star = xy[discrep_list[c_fit_list==0]]
plt.scatter(xy_star[:,0], xy_star[:,1], c='b', s=300, marker='*')
xy_star = xy[discrep_list[c_fit_list==1]]
plt.scatter(xy_star[:,0], xy_star[:,1], c='r', s=300, marker='*')

plt.subplot(1,2,2, sharex=ax1, sharey=ax1)
plt.title('Predicted assignments',fontsize=18)
plt.scatter(pred_0[:,0],pred_0[:,1],c='b',s=40)
plt.scatter(pred_1[:,0],pred_1[:,1],c='r',s=40)

xy_star = xy[discrep_list[c_pred_list==0]]
plt.scatter(xy_star[:,0], xy_star[:,1], c='b', s=300, marker='*')
xy_star = xy[discrep_list[c_pred_list==1]]
plt.scatter(xy_star[:,0], xy_star[:,1], c='r', s=300, marker='*')

plt.tight_layout()
(Ward-Clustering.ipynb; Ward-Clustering.eval.ipynb; Ward-Clustering.py)