Python source code: [download source: plot_timescales.py]
from msmbuilder.example_datasets import FsPeptide
from msmbuilder.featurizer import DihedralFeaturizer
from msmbuilder.decomposition import tICA
from msmbuilder.cluster import MiniBatchKMeans
from msmbuilder.msm import MarkovStateModel
import numpy as np
import msmexplorer as msme
rs = np.random.RandomState(42)
# Load Fs Peptide Data
trajs = FsPeptide().get().trajectories
# Extract Backbone Dihedrals
featurizer = DihedralFeaturizer(types=['phi', 'psi'])
diheds = featurizer.fit_transform(trajs)
# Perform Dimensionality Reduction
tica_model = tICA(lag_time=2, n_components=2)
tica_trajs = tica_model.fit_transform(diheds)
# Perform Clustering
clusterer = MiniBatchKMeans(n_clusters=100, random_state=rs)
clustered_trajs = clusterer.fit_transform(tica_trajs)
# Construct MSM
msm = MarkovStateModel(lag_time=2, n_timescales=5)
msm.fit(clustered_trajs)
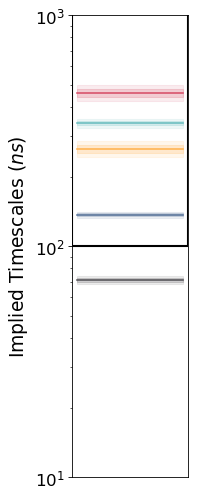
# Plot Timescales
colors = ['pomegranate', 'beryl', 'tarragon', 'rawdenim', 'carbon']
msme.plot_timescales(msm, ylabel='Implied Timescales ($ns$)',
color_palette=colors)
